Pages

HTML5 and the Limits of Imagination

Tuesday, December 11, 2012
I just (days later than everyone else) came across this awesome Google Maps application built by Darren Wiens using the buckled-on graphics capabilities of paper.js. It strikes me as a perfect example of good imagination at work on complex geographic problems. Specifically, this is a mixture of pure javascript, HTML5 browser-boosting and advanced trip routing, all to make a cool visualization of where traffic bottlenecks will arise.

The application calls on paper.js to generate an endless series of random point-to-point trips within the map view, then passes them to Google's routing API and renders the result visually as a trip on the local road network. Over a short time, the traces of the trips build up into a density map of highest traffic:


So as is my wont, I grabbed the code (Thanks again to Mr. Wiens) and adapted it to my home territory of Burlington, VT, with a bit of map styling for contrast (modern browser required):


I intend to spend a lot more time figuring out the ways that new graphics modules can interact with the maps I build, but as always I'm limited by my own imagination. It seems like the technology is increasingly unlimited in capability.

Read more ...

Hashtags and Hurricanes

Wednesday, December 5, 2012
I was scoffing at Twitter a few years ago. Actually, I was openly mocking it, jeering that perhaps 140 characters was too verbose for the new world order.

Then came Hurricane Irene.

Vermont got slammed to a degree we hadn't experienced in a century. Flooding cut off whole towns and wrecked hundreds of miles of roads. Communications were a thicket of half information and delays as the news media tried to step in for a crippled emergency management system. But while working with the Ushahidi platform in support of VTResponse, I discovered that Twitter was ablaze with actionable info. 14,000 tweets used the #vtirene or #vtresponse hashtags during the storm, and Ushahidi vacuumed them all in for automated and manual analysis, then channeled them off to state and local officials. I saw the power of Twitter.

These capabilities were recently tested again when Hurricane Sandy showed up, and with a bit more experience I observed that Twitter by no means removes all the noise and confusion. Two incidents raised my hackles:

  •  Burlington, VT - and indeed the broader Vermont community - have long used the #BTV hashtag to organize news that runs from mundane to crisis-critical. I had configured a new instance of Ushahidi to note #BTV tweets as Sandy got closer, so it caught me off-guard when Bloomberg TV started soliciting photos of storm damage using #BTV. With visions of flood-isolated Vermonters unable to get their message through a deluge of Manhattanite instagrams, I politely asked that they use a different channel. I heard nothing back from the TV station, but it was a moot point; they got very little traffic on #BTV despite the fact that NYC got walloped and VT mostly escaped unharmed.

  • Encouraged by the successful use of Ushahidi and Google's Stratomap plaforms for crisis mapping during Irene, the world's largest producer of mapping software - ESRI - decided to go full-court press during Sandy with their own crisis response web maps. The problem is they're not that good at it. Taking more of a marketing approach, ESRI blanketed Twitter and the #sandy hashtag with links to "Map galleries" full of redundant chartjunk, mostly pulling data from FEMA and local response agencies.

"How do I get to a Red Cross station? Yellow dots, blue crosses? I have to install Silverlight to view this?"
On Twitter, this diverted thousands of clicks worth of traffic away from information Rally points like Google and FEMA (who was actually using ESRI web tools, just with some forethought). Ironically, almost every emergency response agency was using ESRI's desktop software to coordinate infrastructure and personnel; ground-level geocrunching is ESRI's great strength. But their half-baked web tools only served to dilute any sense of authoritative information on Twitter as Sandy raged into the coast. Afterward I had a productive conversation with ESRI's Public Safety Marketer, but it's not clear that their approach will change in the future. Hopefully their tools will.

These complaints each deserve a post of their own, but I prefer to minimize my ranting about the negative side of technology. However, I'll be bearing all of this them in mind when the next emergency hits and we look to Twitter for rapid distribution of news. For better or worse, Twitter and Facebook are tools of public information during crisis situations, and it is incumbent on us to amplify the signals of highest priority and applicability.

Read more ...

Secession & Racism: a Spatial Analysis

Thursday, November 15, 2012

Can a state's tendency toward racism determine it's willingness to secede from Barack Obama's America?

Maybe.

There's the short answer. The longer one follows, and please note the many qualifiers before you fire up the Troll-o-Matic 9000.

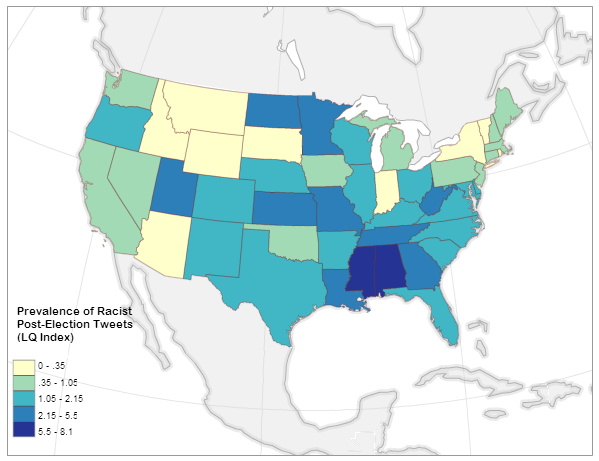
Post-Election Racism

It turns out that there was a lot of racist language being bandied about on twitter after the election. And a small group of brilliant individuals elected to post their hate speech with geolocation attached. The good folks at Floating Sheep were there to catch it all and they boiled it down to a normalized index of the prevalence of racist tweets about the election by state:


A very small number of people in Alabama and Mississippi don't come out of this analysis looking very good. But the point here is that among social media users, Alabamans and Mississippians are slightly more likely than others to vent about the election using hate speech.

Post-Election Support for Secession

At the same time, citizens of some (initially Southern) states initiated online petitions calling for peaceful separation from the United States, AKA secession. These petitions have quickly spread to every state in the union, but the number of signatures varies wildly. As of this writing, Texas has over 100,000 signatures on its petition, while Vermont has 869 [and some colorful arguments have been made about keeping these specific two in separate countries].

Obviously you can't compare these two numbers on the same plane. To get a picture of the real support for secession in each state, I normalized the number of signatures by the state population in 2011 per census estimates:


Balanced by 25 million people, Texas is actually not quite as hot for a second republic as the petition might suggest. The northern rockies on the the other hand are desperate to escape, with a much as ONE AND A HALF PERCENT of the states' populations showing up on a secession petition (yes, this is a tiny percentage). The only states with no stomach for independence are pretty close to the map that John Kerry won in 2004 (with the odd inclusion of Virginia). This is fascinating on its own, but let's dig deeper . . .


Why do you really want to secede? I mean, really why?

All well and good, I thought, but what sort of motivations drive someone to sign onto an idea that half a million Americans died over not so long ago? There are as many explanations as pundits to make them up: culture, climate, economics, and one that comes up every now and then: racism.

So much coded language was thrown around during the election cycle that "Welfare" translated as "Greedy Black People" and "States' Rights" translated to "White Power" to some who were inclined to hear it. In such an environment it's not inconceivable that some citizens would rather leave the U.S.A. than dwell another four years under a president whose legitimacy was so exhaustively questioned.

Relationships like that are extremely difficult to tease out. There are potentially hundreds of factors driving an individual's decision to sign a petition like this, and the president's ethnicity may be only the smallest one - if it's present in the calculation at all. Colinearity is the term the statisticians like to throw around: you think you've got a significant relationship between two variables, but it's really a parallel factor that you forgot to measure.

Therefore, a non-exhaustive list of caveats before I get to any results:
  • Fewer than 400 geolocated tweets included both racist language and a reference to the election. This is a tiny number compared to the overall election-related traffic, and Floating Sheep has made this clear in their analysis. The author of that post judiciously used the term "Thin nail to hang on" in reference to my use of his dataset. That said, there was also a significant amount of non-geolocated twitter traffic using hate speech in the days after the election, so these are representative of a larger tone if not of a geographic location.
  • Signatories to these secession petitions are not all residents of the state in question. About 3/4 of the Texas petition participants appear to be Texans, while only about 1/4 of Oklahoma signatories are locals. Without a good way to sort out locals-only, I just included the total number on each petition and in doing so introduced more error. 
  • The analysis method I use below doesn't eliminate colinearity. It just suggests where it might be strong and where it might be weak. It's possible that racists in Georgia really love pandas, and it's actually the broader panda-loving population there that wants to secede so that the federal government can't seize any Georgian pandas.
  • Similarly, this analysis helps with - but does not eliminate - the modifiable areal unit problem.
  • Alaska and Hawaii have secession petitions too, but their non-contiguity with the lower 50 skews the results.
  • This is only scratching the surface. If there's a grad student out there with funding and no project, I invite them to burn time improving the input data.
  • More as they occur to me . . .
With these qualifiers in mind, let's look at the straight-up linear relationship between racist tweeting and secession-petition-signing. The big question I'm asking here is "Can a state's tendency toward racism determine it's willingness to secede from Barack Obama's America?" And I'm not answering that question; I'm answering a highly-qualified version of it based on the data I have available. Plus it's kind of a nutty question.

And at the national level, the answer to the question is no:
This "relationship" at the national level is not significant at any useful confidence interval, and it sports only the tiniest of trends (P = 0.36, R-squared = 0.017).

Before I lose the rest of you, let me say this: The answer to the above question could still be "maybe".

There's a statistical tactic available called Geographically-weighted regression (GWR); it's best described as a diagnostic tool to figure out how relationships like this can vary over distance. Instead of measuring the relationship between racism and secession at the national scale, we can look at it regionally to tease out places where it might be valid:

This map shows where it's possible that the prevalence of racist post-election tweets can predict the local support for secession. 
Cutting through the fog of colinearity, we're left with four states that exhibit the signs of correlation between racism and secession: Kentucky, Tennessee, Georgia and Florida. Anecdotally this isn't nuts; the very real secessionist movements in Northern New England express an odd motivating mix of social liberalism and Rand-ian libertarianism. On the other hand the Southern states actually did secede once, and whether you give it a Marxist reading or not, the resulting war was about the intertwining of race and governance. The banner-bearers of southern secession before this petition fracas included not a few white supremacist groups.

Many on the political left are trigger-happy with the use of racism as an explanation for any opposition to the president. The above analysis shows that this may be the case in some places. However, it must be pointed out that it also shows there is no strong link between racism and secession (using proxy terms here) in many "red states", including Texas and Mississippi. Other factors not analyzed here are most likely driving the petitions in those states. This is not to say there's no racist twitter activity in Texas, just that it's not really correlated with support for secession.

Here's the qualified conclusion born of all this flying data:

In a few southern states it is possible that the drive to secede from the United States is being informed by racism on some level. 

This is surely news to no one, but I thought it would be useful to look at the statistical underpinnings of it. Make of this what you will.


    Read more ...

    Maximalist Mapping

    Monday, November 12, 2012
    I am a journeyman cartographer, and I often find that my training didn't prepare me for the possibilities available today. It's all well and good to know the right ratios and color schemes, but how am I supposed to learn the right way to incorporate the nuttery that is Mapnik? How do I use compositing operations and CartoCSS in my maps without making them look like the worst visual excesses of web design?

    By spitballing.

    I'm throwing data, textures and cartographic conventions at the wall and seeing what sticks. Some combinations work better than others, and I'm finding that maximalism isn't all bad. There are elegant ways of arranging a thousand features in a map, and hopefully I'll stumble on them someday. In the meantime, here are some studies.


    More of these fiddlings can be found here, with CartoCSS parameters attached in most cases. It's also worth noting that I used Tilemill for these, employing datasets from Natural Earth 1.4 and patterns from ForHumanUse. Most are open-source, all are free.

    These are static images, and the test I'm now finding most difficult is how to make arresting visuals meaningful when dynamism is required. Many have failed, including me.


    Read more ...

    VoteMapping

    Tuesday, November 6, 2012
    The big day is upon us again, and since my vote in the people's republic of Vermont (The GOP's term, not mine) doesn't really matter, I've turned my attention to the national level. First, to the many controversial things appearing on Twitter:


    Well, turns out when you cast a broad net people are actually saying some pretty hideous things on Twitter. This app I knocked together a few months ago from a Mapbox template reveals the tweeting public in all its grammar-deficient, race-baiting, socialism-misdefining glory. I stopped watching it after the last debate, since it was damaging my faith in humanity:


    It'll be more interesting to see if any of the many "Election Crowdsourcing" apps produce robust datasets about the differences in voting experience around the country. Twitter is too hard to mine for precinct-specific context about wait times at polling places (Don't believe me? Give it a try.), so I'm hoping to see some useful information from MyFairElection and Mother Jones.

    If you note others who are collecting such info, please drop me a line in the comments or on Twitter (@vtcraghead). Because this is my mapping project for the today if I can get enough data:

    Read more ...

    Results of the Burlington Neighborhoods Project

    Friday, October 26, 2012
    Thanks again to everyone who submitted neighborhood boundaries to the BTVHoods project. Results are now crunched!

    This map was compiled from over 400 sketches submitted by 104 participants in an online survey of the neighborhoods of Burlington VT, conducted between August and October 2012. The areas shown here reflect where participant agreement was greater than 50%.


    These are available - cleaned for admin use - in geojson format here.

    I pulled out block group boundaries from the latest US census (2010) and assigned them to neighborhoods to get a picture of how many people lived in each. Bear in mind that the numbers look exact, but the boundary lines are vague so these "neighborhood populations" should be taken with a grain of salt:


    And a look at some of the smaller neighborhoods, contained by larger ones on the map:
    Read more ...

    The Buffalo in the Room Part 2: Fade Out

    Sunday, September 16, 2012
    In the last post we looked at the many difficult paths that can take us to the summit of cartographic nirvana known as the "Buffalo Tint", as rocked by National Geographic Maps and others

    As I noted, this effect has traditionally been impossible to pull off in a GIS platform like ArcMap or QGIS. Tilemill initially got us a little bit closer by giving us full control over styling possibilities with CartoCSS code.

    But now, as of Tilemill 0.10.0, compositing functions make this kind of effect a snap. Let's look at making a full Buffalo Fade, still using South Sudan as an example. Specifically, we're going to make a fade mask in Tilemill that can be laid over some Mapbox base layers in a web map.


    Step 1: Preprocessing a Mask

    This step - preprocessing in a GIS platform - is optional, it just depends on where you want the fade to begin. The purpose of preprocessing is to create a fixed feature mask;

    • QGIS: Run a buffer on your focal feature, larger than the convex hull of the feature for good measure. Then run a difference process between the buffer and the focal feature. 


    Either way you're aiming for a feature mask that looks like this:


    Step 2: Into Tilemill


    Then import that feature mask into Tilemill and style it with what might be the most efficient piece of code I've ever cobbled together, compositing the feature mask to fade inward from its border:


    [Alternately, in this case you can do it by just compositing every country that isn't South Sudan and eliminate the buffer processing above. Here's the CartoCSS to do that]

    That's it. Export to MBTiles format and drop it on top of a base map of your choice. You're off to the races:


    There are still a few bugs when using this for dynamic tiles, notably some tile-edge artifacts that break up the smoothness. But overall I'm looking forward to messing around with these new compositing capabilities


    Read more ...

    The Buffalo in the Room Part 1: Fade In

    Wednesday, September 12, 2012
    Since the ancient days - well, since late 1993 or so - production cartographers have been been stuck in an awkward technical limbo between GIS and art. Two platforms were required to get a map from vector geoprocessing to publication-quality graphics: Mostly ESRI's ArcGIS for the former and mostly Adobe's Creative Suite for the latter. Sure the two tried to overlap each other as time went on ("Seven hours to export a 900dpi TIFF and I can still see the pixels? Thanks ArcMap!"), but the basic math was tough to overcome: with finite memory on a workstation, ArcGIS focuses its resources on geoprocessing at the expense of the graphic outputs, and vice-versa.

    This was the way of it when I started mapping. And the classic example of "You can't do that in GIS" is the buffalo tint popularized and used to wicked effect by National Geographic Maps. Basically it's a targeted feature fade, meant to draw attention to a focal point or to one side of a divide. And pretty hot too.

    And it's not really possible in ArcMap. Here, let's try doing the inverse of a fade, which is easier to envision. This is more of a halo, and it's theoretically possible to do this by adding line layer after line layer, each offset and transparent-ed a bit more than the last:

    Buffalo Halo a la ArcMap
    Not too shabby, I suppose. A fade out from a clear focal feature. Maybe a bit heavy-handed, but it gets the message across. Too bad it took 30 minutes of clicking into five successive sub-menus on each of ten layers to get it done. And since ArcMap isn't a graphic engine, there's no anti-aliasing, and pixels are visible in every feature. This is not a production-quality graphic.

    Let's try that again with Tilemill. I know I know, it's not a GIS engine, but it's a lot closer to one than Adobe Illustrator is, try as they might. Tilemill has full support for operations like selecting and styling by attributes as well as basic geoprocessing if the data is tied to a source like PostGIS, Google's data API or CartoDB's SQL API. Also it's free and open-source (I love that such news is ancillary to my point here. Woot!). As I've mentioned before, Tilemill brings the efficiency of CSS code to the map styling process, and it pushes everything through the sophisticated Mapnik graphic driver to look damn pretty for web or print.

    Code will save us, right? Here, check it out:

    Buffalo Halo a la Tilemill
    This is a more subtle effect, with no striping artifacts, and all the linework is anti-aliased for smoothness. Bonus points for also providing an interactive output where the halo scales dynamically.

    So what kind of Carto CSS went into that? Oh, just more than three hundred lines of recursively offset style code. Oy. It's true that it's portable (feel free to plug the code into your own project), but it's not ideal. Definitely not for fast projects under a deadline.

    This is where compositing comes in. Last month, the indefatigable Mapnik team added support for the graphical magic that underpins programs like illustrator. This is part of a long-running effort by cartographic designers at Stamen and Development Seed to get out from under the Iron Adobe boot. (or the supple GIMP moccasin, I suppose). With compositing, all sorts of things become a lot easier to do in Tilemill, for instance what we've been trying above is now about 30 lines of CartoCSS, and much richer:

    Buffalo Halo with Mapnik Compositing Mojo in Tilemill
    The possibilities are sort of mind-boggling, and I invite all the actual graphic designers of the world to figure them out (The composite parameter alone in CartoCSS has 35 options). In the meantime I'll continue to look for ways to enhance my mapping toolkit; the next post will focus on reversing the direction of this effect, like in the NatGeo example linked above.

    Free-Range Buffalo Halo, Thriving in its Natural Environment.
    Thanks to Dane Springmeyer for pointing out the time-saving parameters on this one.

    Read more ...

    Map Texture Studies

    Tuesday, September 11, 2012
    Given enough time to play with them, I'm coming to adore the new Mapnik image compositing features available in Tilemill. I'll cover some methods in more detail in the next few days, but for now here's a look at a series of map background textures, composited through geographic features. The vignettes below are displayed with their attendant carto parameters for your re-creative enjoyment. Click here to see the full set.


    Many thanks to AJ Ashton for fiddling assistance and to Dane Springmeyer (+Artem & the Mapnik crew) for hacking the new features. [Mostly] seamless texture tiles generously provided by Dave McNally and Patrick Hoesly.

    More compositing to follow . . .

    Read more ...

    The Official Takeover

    Wednesday, August 29, 2012
    High Seas by AJ Ashton. Pirate by Lego, clearly.
    ESRI has made some interesting moves in the web mapping space in the past year. I don't blame them for being desperate to get a grappling hook up on a ship dominated by a combination of Google Maps and an open-source polyglot, but at this point the attitude is starting to border on dickish:

    • Step 1: ESRI rumbles toward a unified way of getting licenseholders' data online, while pulling a group of early innovators - GeoIQ - onboard to help. Admirable.
    • Step 2: ESRI adopts the term "Web Map" along with "Story Map" and a few other items that they clearly stole. No worries; a bit of rebranding and we're all one big-happy-web-mappy family, ESRI, Google, FOSS4G and your grandmother with her Bing API side project.
    • Step 3: ESRI kicks everyone else off the boat they just boarded. Now only ESRI makes "official" web maps, and clients should be wary of cut-rate imitators. Specifically a "Web Service" is only an ESRI REST service, and a "Web Map" is "[Like an] .mxd file, but for the web." 
    Okay, this is an oversimplification - particularly that step 3 doesn't come from ESRI directly, but from a well-intentioned partner. Well-intentioned because the author clearly wants the "Average GIS professional" to have access to the brave new world of the cartointerwebs and that path is not currently an easy one. But this attitude doesn't arrive in a vacuum; ESRI has cultivated it in the hope that no one will notice they didn't innovate the web mapping space. Web developers did and still do. Folks from tiny open-source shops all the way up to search giants.

    Fair play to the big guy with the marketing budget, you say. But here's why I want the developers that built this ship to retain control of it: THEY'RE BETTER AT IT. The user experience is uniformly superior in non-ESRI web maps, the implementation costs are lower and the data is faster. Though this will change and ESRI will catch up if new hires like Sean Gorman have anything to say about it.

    But for now I would love to see a bit of humility and willingness to listen on the part of the GIS giant, instead of taking the ship by storm and kicking off everyone who knows how to steer it.
    Read more ...

    Data-Driven Symbology in Carto

    Tuesday, August 7, 2012

    The term "disruption" makes me want to stick a hot poker in my eyes, and then post a tilt-shifted instagram pic of that poker laying on a table next to a lychee mojito.

    However, "disruption" is an accurate description of the state of cartography over the past two years or so. The traditional realm of the GIS analyst has been invaded and turned upside-down by an army of new cartographers who come from a software development background. These visigoths have brought odd notions like efficiency, economy and - heaven help us - design to the mapping field, but wow do they have a different process for making maps.

    This dichotomy between GIS-er and carto-developer is visible in the CartoCSS language. Stemming from a project called Cascadenik, CartoCSS is a collection of stylesheet code that allows a mapper to assign symbology to geodata and render it with Mapnik - by far the best image rendering engine available for cartography. This code distinctly resembles the assemblage of rule sets, blocks and properties that any web developer would use to style a web page (hint: the target user base):

     #wind {    marker-width:5;    marker-fill:#DADDE2;    marker-line-color:#fff;    marker-fill-opacity: 0.6;   }  

    The highest-profile deployment of CartoCSS is in the excellent Tilemill mapping platform from the folks at Development Seed. The code drives every style choice you make in Tilemill, then it compiles everything to Mapnik and delivers you exceptional graphics, both static and web-ready. This is great news for developers, who are already comfortable with code in their workflows. Not so much for the GIS analysts (like me) who have been Arc-trained for years on how to push buttons and move sliders in the quest for a good map. Also, CartoCSS has had limited functionality for thematic mapping - a common complaint is that you can't do multivariate symbology (graduated colors and symbols, say) without awkwardly-nested code cascades.

    Until now, that is. A key development has been taking place behind the scenes, one style parameter at a time -- data-driven symbology has arrived in CartoCSS as of Tilemill version 0.10.0. Let's take a look at what this means:

    Figure 1 - Marker Size
    Previously, you needed to specify a hard number as a value for almost every style parameter. Translated, that means the point data (representing weather stations) in figure 1A was coded like this:

     #wind { marker-width:10; }  

    To make graduated symbol sizes, you previously had to put in a plague of conditional statements over many lines, each pointing to a different value for marker width. Now you can just pull those numbers from attribute data; in figure 1B, the points are graduated based on average wind speed, with the values coming from the attribute field labeled "mph":

     #wind { marker-width:[mph]; }  

    You can even manipulate the attribute-derived values directly in CartoCSS with basic math. In figure 1B, I've multiplied everything by 2 for an exaggerated effect. Things get interesting when you try styling on multiple variables - one on symbol width (wind speed) and one on symbol height (station elevation) in figure 2B:

    Figure 2 - Multivariate Symbology

    Label placement has long been the lone data-driven feature in CartoCSS. This code renders the weather station labels in figure 3A:

     #wind { text-name:"[STATION NAME]"; }  

    Now you can orient labels directly from a column, for instance to make them point in the average wind direction in figure 3B below (fun but cartographically criminal). Makers of typographic maps should pop a celebratory beer over this one; a little bit of geoprocessing and your work is automated now. [Update: I'm told the real purpose of this is to orient interesting text characters like Arrows (-->). It's all fair game.]

     #wind { text-orientation:[direction]; }  

    Figure 3 - Label Rotation

    Building heights for "Pseudo-3D" effects can also now be pulled from attribute data. Figure 4A shows building outlines, 4B shows all buildings rendered with a height of 8pts, and 4C shows them rendered at actual height in meters with a vertical exaggeration of 2. Woot.
    Figure 4 - Dynamic Building Heights

    The possibilities are not limitless here. It takes a fair amount of chopping away at the Mapnik source code to enable each of these data-driven parameters, so the list of available ones is still pretty short. Nor does this make CartoCSS the absolutely-ideal entry platform for a GIS analyst looking to get into "Map Development". However, this represents a forward leap in ease of use for mappers of all stripes, and I look forward to seeing what the community can do with this functionality.


    Read more ...

    Results of the Geo Toolkit Poll 2012

    Monday, July 23, 2012
    Many thanks to everyone who participated in this survey of the geospatial industry. I tried to get a platform-agnostic look at the tools that are most-frequently used in our community, and after 250 responses I think we have a useful glimpse of the scene.

    My reason for running this survey: I'm tired of speculating. As a multi-platform user I don't know where I stand with my clients and competitors, let alone in this sprawling industry, and I've heard lots of similar curiosity from colleagues. I call this an independent survey in that no vendor funded it (nobody funded it, actually) and it isn't for marketing use. This is a community poll, nothing more. Onward . . .

    Methods

    This is worth a cursory glance, since the results are inevitably colored by the collection routine. I relied almost entirely on social media to get the word out, specifically:
    • Numerous twitter solicitations to my ~500 followers, retweeted to a combined audience of over 11,000 utilizing hashtags for both the ESRI User Conference and OSCon - probably annoying the crap out of everyone in the process
    • Google+ and Facebook posts
    • Listserv posts to ESRI, OSGeo, OSM and Google user groups
    • Posts on the three largest geospatial groups on LinkedIn
    Given the warren-like distribution network, I do not know how many people saw this poll. Thus the sample size is 250 out of an unknown population, and no big-picture conclusions should be drawn. Also let it be known that the balance - even if measured properly - changes from month-to-month.

    Results


    Question 1: Which of the following geospatial technologies have you used on at least one project in the past year? [Note - I Included pre-purchase GeoCommons on its own out of morbid curiosity; I otherwise would have included it with FOSS4G Web Tools]

    Some of the technologies that went into the "Other" column include FME, MicroStation, ENVI/IDL, GIS Cloud, AutoDesk, Maptitude, Idrisi, ERDAS, MapProxy, R-Spatial, Garmin Basecamp, Oracle XE, Ushahidi and Geocortex. Sorry to have ignored those, but it's a big ecosystem out there.


    Question 2: Which of the above technologies did you use most frequently in the past year?


    Platform Gregariousness: Do you cross over from your primary platform? e.g. ESRI is your main platform but you've also used Google Maps/Earth at least once in the past year. [A venn diagram would be cooler but the chart API was inscrutable]


    Use by Business Sector:


    Use by Country: (Click here for fullscreen glory - we're all cartographers here)


    There's a lot to see in these distributions - an ESRI lean among U.S. respondents, a FOSS4G lean among Europeans. Also interesting to see how the sectors use these tools. See anything of note? Anything obviously-spurious? Do tell - I think there's a good discussion to be had here.

    I'll say it again: this was not a scientific, controlled survey. It's a snapshot or an anectodal collection; take your pick. But it is nonetheless interesting to see what this group of mappers uses to get the job done. Thanks again to you all for pitching in, and maybe we'll try an expanded version next year.

    If you're interested in the raw, messy results (stripped of unique identifiers of course), hit this link for an XLS download, and happy parsing!


    Read more ...

    GeoTools 2012 Poll - Round 2

    Monday, July 23, 2012
    Expanding the search around the Geo Community:

    Read more ...

    Results of the Geospatial Technology Users' Poll 2012

    Friday, July 20, 2012
    Update 7/23/12:  The poll is now reopened and live results are appearing at a new post. The figures and discussion below should be considered preliminary

    Thanks to all those who hit yesterday's poll of technologies at work in the geospatial field. I've got some interesting results below.

    First a note on experimental design: This crap is not scientific. First I tweeted, facebook-posted and Google+'d, so I got in contact with the core community of geogeeks with whom I regularly interact. Then I sent it out via the Vermont GIS listserv, the ESRI user conference hashtag and the O'Reilly open-source conference hashtag, hoping for balance. There is surely a geographic skew toward the U.S. Northeast, but I'm pleased with the general distribution of respondents. n = 117, which seems pretty good to me. Hit me on Twitter or on the GeoSprocket contact page if you'd like a copy of the raw survey results.

    Here's a look at the participants using the generalized locations of reported companies/institutions (lots were left blank, so who knows):


    The results of question 1:

    Note: Some of the technologies that went into the "Other" column include FME, MicroStation, ENVI/IDL, GIS Cloud, AutoDesk, Maptitude, Idrisi, Mapserver and Geocortex. Sorry to have ignored those, but it's a big ecosystem out there.

    And the results of question 2:
    Ayup, ESRI Desktop is the big winner in this circle. But a surprising number of Google Maps folks there too. Also intriguing is the even split among the open-source toolset types, contrasting with the topheavy ESRI lean toward desktop.

    Here is primary toolset use by overarching category:


    Things get interesting when we parse out some conditional results:
    • 40% of users whose primary tool is an ESRI product have also used an open-source geo platform in the past year.
    • But a whopping 80% of users whose primary tool is open-source (desktop, web or DB) have also used an ESRI product in the past year.
    • Same with Google - 80% of respondents who primarily use Google Maps have also used an ESRI product in the past year.
    • That favor is largely returned - 75% of primary-ESRI users have used Google Maps.
    • OpenStreetmap and GeoCommons had plenty of casual users, but very few used them/built them as their primary tool (1% each).
          There's a venn diagram to be had in there somewhere, but I'm not up to it.

    Without leaping to conclusions, I would say that it's still an ESRI world. Even the folks whose day-to-day revolves around open-source or Google tools still fire up an Arc license every now and then. The converse is not equivalent; fewer than half of ArcJockeys use any of the open-source tools, though they are partial to Google Maps.

    There are a lot of potential reasons for that, but it seems safe to say that open-source geo is still developers' territory, and Google mapmaking tools are more comfortable ground for ESRI's users. I recall that specific path when I was making my own way from ArcGIS to GDAL and Javascript.

    There's a lot to read here; what are your thoughts? Anything surprising?


    Read more ...

    Geo Users and Developers Poll, 2012

    Thursday, July 19, 2012
    Thanks for your round 1 responses! Round 2 is live now at this page.

    It seems like the right time to get a community pulse on the use of various geospatial technologies. Please choose items whether you've worked to develop the tools themselves or used them on the client end. There is some inevitable overlap between categories, but use your best judgement.

    I'll put the results up in the next blog post. Thanks for participating.

    Read more ...

    Open Source, Open Data, Open For Business.

    Tuesday, July 10, 2012
    GeoIQ and an Origin Tale


    In 2009 I was a "GIS Technician". Heaven help me, I was auto-completing polygons on good days and schema locking on bad ones, at a well-meaning but projection-free engineering firm with 300 AutoDesk licenses and 5 ArcEditor seats. It was the worst of times.

    Early on that year I took a week off to go to Las Vegas with my wife, who was presenting at the AAG conference there (she's the brains of the outfit). Benefiting from the super-low "Spouse" attendance fee (academic geographers take note), I wandered from one cool session to another, my brain stimulated in new and exciting ways. I watched in a standing-room only crowd as Jack Dangermond explained how mashups (remember those?) were going to solve Africa's problems, and I saw my first demonstrations of Object-Oriented Image Analysis and Hyperspectral wetlands detection. Cool enough, but there was something disheartening about the fact that 95% of the map crunching I saw was being done by ESRI products.

    On a whim, I went to a panel session called "Open Source GIS". Probably for the damn novelty of it, but also maybe due to some lingering frustration from being license-bound while trying to do mapping work in my peace corps years. The little room was about 3/4 full and the panel consisted of some folks from USGS who used GRASS and PostGIS, and also an animated fellow named Andrew Turner from FortiusOne, who had a few things to say.

    The Open Source GIS Panel at AAG 2009. Note the overdressed gentleman about to drop some science on us. (Photo courtesy of  Shriram  Ilavajhala)
    It was no great conversion moment. The session covered some pretty wonky stuff from the perspective of a button-clicking non-coder, though the enthusiasm was palpable in the audience. The real "Glitch in the Matrix" hit when I talked with Andrew after the session. In an information stream that challenged the human limits of spoken words per minute, he told me it might be helpful if I downloaded Quantum GIS (1.3, yo.) and took a look at GeoCommons.com. Back at my computer, the world opened up to me; this was the starting event that would lead to the creation of Geosprocket a year later, and for that I am eternally grateful.

    An early, misguided attempt to use GeoCommons in mapping global coffee production. Things have gotten better.
    In that session and in subsequent interactions, Andrew conveyed two motivations for his work with FortiusOne-thence-GeoIQ.
    1. Open Source: OS software is just the tip of the iceberg. It fosters a culture of innovation and robustly supports the tools that people want most.
    2. Open Data: Geographic information should be a public good (Geo"Commons" - Get it?), and we can all benefit from driving maps into the public sphere.
    These drivers were not unique to GeoIQ; they are dear to many in our community. Over time I have adopted these and included them in the core of Geosprocket's mission. As such it was something of a body blow this morning to read the news that GeoIQ had been purchased by ESRI. The pundits have already weighed in eloquently on this deal, and I can't add any new market analysis. I've even run out of snark. I can only mourn a bit to see GeoIQ forced to choose between open source and open data, for they have surely chosen the latter.

    I have no doubt that ESRI's resources will supercharge GeoIQ's pursuit of open data. If Jack and co. have the wisdom to scrap ArcGIS Online and replace it with "ArcIQ" the world will be a better-informed place. But I'm going to miss the code contributions of some talented individuals. I raise a glass to them for getting me started in this business.


    Read more ...

    American Agriculture on the Ground

    Monday, July 2, 2012
    The day following my cousin's wedding in Geneva Illinois, I climbed into my rental car and cruised West a few miles. I had some time before my flight back East and realized I didn't know what a real cornfield looked like. Not from the ground, anyway. Though I'm working on a PhD in agricultural remote sensing, I spend my days analyzing crops from a vertical perspective of several hundred miles up - from high-resolution satellite instruments that can tell me a lot about cultivation patterns, vegetation health and potential crop yields. I can do this without leaving my office, and the Vermont landscape where I've lived most of my life is a hilly mosaic of field and forest. The largest corn plot in my neck of the woods is about 50 acres.

    Where I was in Illinois, on the other had - seen from the air - could be plausibly called the start of the cornbelt. It's where the Chicago exurbs come to a surprisingly-abrupt halt and are replaced by a gradient of endless agriculture heading to the rockies - first the large grains, then wheat and hay, then rangeland, and not a lot of people. So I went to have a look. It only took a few minutes' drive to get beyond the housing developments and among some of the broadest agricultural expanses I'd ever seen live. I pulled off the road at one spot that looked fallow - like I could walk freely there - and got out of the car.


    The line is drawn outside of Geneva, IL
    10AM and already over 90 degrees, it was not a hospitable environment for a northern desk jockey. But shimmering just beyond the fallow was an easy 500 acres of cultivated land, split evenly between recognizable corn and alien-to-me soy. Flat as the griddle before the pancake batter hits it. I broke a sweat and trudged out into the fields.

    A few things were noticeable. First that the fringes of the field had smaller plants; this is nothing unique to the midwest, and usually due to some tricks of drainage and fertilizer-scattering angles. But the corn plants suffering on the edges here were still twice as tall as the healthiest of those I'd seen the week before in Massachusetts, burdened by draught upon heatwave upon hail upon late frost. The soy plants here I at first mistook for some monstrous cover crop, with leaves like clover growing a foot up out of the ground. 
    Soy


    Corn
    There were distinct drill-planting scars in their rows, cracked wider in the heat and the dry. The two crops ran into each other in a perfect line, like allied brigades marching in formation rather than opposing armies that have crashed together. In most of the country outside of the Northeast, corn and soy are planted in an annual rotation. They both serve as cattle feed and compliment each other - soy brings nitrogen to the top soil horizon for the corn to thrive on the following year. The scattered cornstalks serve as fertilizer and mulch for the soy sprouts the year after that. On and on, with fallow making its way into the lineup less and less frequently.

    I stooped to take some pictures of the rows, and I held a soy plant in my hand. The heat was impossible. I felt myself wilting, desiccating with no shade in sight. The leaves of the plant, however, were thick and healthy, bouncing a bit in the breeze. The robust copse of the stalk was covered thickly with a soft, spiny fuzz, and a few flowers were just peeking out of their exploratory growth. The corn as well seemed to be taunting the sun, suggesting it could do worse.

    These were genetically-modified plants. There were no tags and no one to ask, but I could say it with 97% certainty. Most likely from a family of seeds that Monsanto brands "Roundup Ready" for their ability to convert sunlight and soil to biomass at a ferocious rate while being regularly doused with a proprietary insect-and-weed-killing cocktail that could plausibly be used to kill humans with the right concentrations.

    I walked across to the other side and touched a corn broadleaf. It was already wider than my hand, and the whole plant came to the height of my nose, with two months yet to go. One ladybug reclined on the leaf, which was otherwise completely devoid of noticeable insect life. What seemed like translucent hairs covered the green surface, projecting the picture of vegetative health. In working with farmers in Central America and the caribbean, I had learned that the interesting stuff was always underneath - turn over a corn leaf and you find a merry band of aphids or a spider with a nest to escape the sun and prey on the rest of the locals. But here the bottom of the leaf was as clean as the top - more of a matte finish than the gloss of the upper surface. Empty as a new house with the plaster still drying.
     I shot some more photos before the sun bested me and I trudged back to the car.  

    Corn and soy grown are grown in the Midwest at a scale that matters, in a way that draws the attention and support of the drafters of a five-year farm bill. Grown toward a subsidized ideal that is more efficient than many steel machines. Extending from where I stood West into Nebraska, North into Canada and South to the Gulf.

    Awesome to behold.
    Looking West

    Read more ...

    Browser Cartography: Some Safehouses for ESRI Refugees

    Wednesday, May 30, 2012
    "Island" by Konstantin Kafer

    A Primer for Getting Started With Open-Source Web Maps


    Now that you know why I care about telling compelling stories with widely-distributed maps, let's look at a few of the many tools that are out there to help the process. I confess to narrow experience here; I use MapBox and CartoDB for the majority of my projects, and there are plenty of alternatives to those. But as a starting point I think that these open-source web map design platforms are perfect - they minimize the amount of code required, they use the best graphic rendering engine in the field, and they are extremely cheap (or free) to use, even in an enterprise or high-traffic environment. I'm avoiding ESRI's "ArcWhatever Online for Server" options because of a.) the high price tag, and b.) the actual user-facing sites are only as robust as the javascript or flash developer who builds them. My preferred options give you a lot more to work with out of the box, for free.

    I am not going to walk you step-by-step through the process below - I'll point you to resources that will - but rather I mean to sketch the structure that can get your map applications up and running. If you're stumbling and need some help, drop me a line through the GeoSprocket contact page or on Twitter

    Step 1: Data


    Data in this context can mean a lot of different things. The tools we're using aren't picky, so this includes:

    • Shapefiles (but this will need to be in a compressed folder)
    • Spreadsheets (CSV, XLS, DBF, you name it)
    • KML or KMZ
    • GPX or in many cases raw text from various GPS units

    Desktop GIS isn't dead. Those who say so aren't paying attention. You still need some form of spatial data manipulator to analyze and prepare your source information, and if you can do that with pure GDAL hacking at the command line of a virtual machine, you have no need for my advice. Yes, "Desktop Platform" includes ArcMap, but if you want to make a clean break I recommend Quantum GIS for robust, open-source geoprocessing potential.


    Step 2: Choose a Platform and Get a Hosting Account

    Your data should live on the web somewhere - where, exactly?
    • Option 1: MapBox - Most advantageous for its speed and complete cartographic design potential. However, once you've rendered your map into tiles (in step 3), there's not much you can do to change them on the fly. Use this option if you have a specific vision of symbology in mind to present to your users, if you have a lot of information to present interactively (i.e. text/charts/images that pop up when a feature is clicked), and also if the underlying data will be accurate for more than a few weeks. Sign up here for the free starter account.
    • Option 2: CartoDB - This is a user-friendly, cloud-based adaptation of the popular PostGIS database architecture. It can run a bit slower than MapBox (since it's rendering on the go), and the cartography options are more limited. However, the provided SQL API means that you can sort, filter and process your data basically in the browser. Go with this option if your application will have a lot of user-generated queries (i.e. "how many points are within 50 miles of this one?"), or if you regularly update the data being mapped. Sign up here for the free starter account (notice the pattern of freeness).


    Step 3: Mapping Your Data


    At this point using either option, you should now have maps that are ready to be launched.

    Step 4: Serving Your Map to the World


    Step 4a: Embedding - By far the easiest way to get a URL that you can distribute to your audience. Both Mapbox and Cartodb have fantastically-easy embed interfaces for plugging maps into your blog or website content management system, and in each case they essentially host a full-page map website for you as well. Examples:


    Racial Breakdown of Census Blocks in Burlington, VT Using Mapbox


    Participatory Farm Mapping in Vermont with CartoDB


    Step 4b: The World of Pages, Javascript and Beyond - This creeps a bit further beyond the scope of what I hope to cover here, but this is the ultimate destination for most of my map applications. There is simply greater flexibility in a website or mobile application that you can manage yourself, though it requires some knowledge of HTML, CSS and Javascript.

    I say "some" knowledge - I didn't know the first thing about code when I got into this world, but it was amazing how easy it was to adapt a little bit. The resources available in the open-source software community are spectacular; the help and guidance offered to me by experienced developers out of sheer goodwill has been uniformly superior to the high-priced support of proprietary vendors (Trimble and ESRI, I'm looking at you). I am no developer, but with community help I've been able to explore and utilize some of the most exciting tools available to cartographers in our time. And things are only getting better from here . . .

    Here are a smattering of places to start for customizing a page of your own:

    • Mapbox Templates - these require a bit of github knowledge, but otherwise they are as close to plug-and-play map sites as you'll find. 
    • CartoDB Examples - Plenty of code available for re-purposing and adapting. In many cases this just involves changing a line or two to point to your own data.
    • Codecademy - Might as well learn how to do this stuff for real . . .


    Read more ...